Appearance
Graph Model & Ontology
When modelling complex challenges in the physical world, traditional data models — rows and columns in a spreadsheet or a relational database — often fall short. They are excellent for storing and organising facts but struggle to represent the intricate web of connections that define reality.
To understand and manage systems like a city's traffic flow, a global supply chain, or a national power grid, you need a model that treats relationships as a first-class concern — not an afterthought to the data itself. This is where graph models come in. By representing the world as a network of objects and connections, you can build dynamic, flexible representations that capture both the individual components and the links that bind them together.
This is the architectural principle at the core of OR.
Nodes and Edges
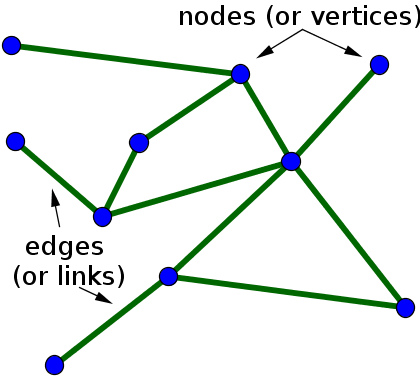
When we talk about a graph in a technical sense, we are not talking about a bar chart. We are referring to a way of modelling the world by focusing on objects and the connections between them.
Nodes are the individual things or entities in your system — the fundamental building blocks. A node could be:
- A train on a rail network
- A vessel approaching a port berth
- A truck in a mine fleet
- A piece of equipment due for maintenance
Edges are the links that connect nodes — they represent relationships and interactions. An edge could represent:
- A train running on a track segment
- A vessel assigned to a berth
- A truck allocated to a shovel
- A maintenance task scheduled against an asset
Together, nodes and edges form a graph — a structure that lets you see not just individual pieces, but the entire network of relationships between them. This relational view reveals patterns and dependencies that row-and-column data cannot easily express.
The OR Platform as a Graph
The same graph model that helps you represent a physical system is the model OR uses to design the platform itself. OR is centred on interconnected graphs of data, models, applications, and compute — four layers that correspond directly to the four layers of the Autonomic Integration Fabric.
Data Graph — DDK
At the foundation is the data graph, which you configure using the Data Development Kit (DDK). All data — from raw sensor inputs to processed operational results — is represented as a network of nodes and relationships. This is not just a database; it is a dynamic, structured representation of system state where the connections between data points carry as much meaning as the data itself.
A "vessel" node is linked to a "berth" node via an "assigned to" edge. A "truck" node is linked to a "route" node and a "shovel" node. A "maintenance task" node is linked to the "asset" it covers and the "crew" scheduled to perform it. This structure lets OR understand and navigate relationships automatically — and it is what powers the world model.
Models Graph — MDK
On top of the data graph sits the models graph, which you configure using the Modelling Development Kit (MDK). This graph represents all the computational models, algorithms, and simulations in your system. Each model is a node; its connections define what data it consumes and what outputs it produces.
A "berth allocation model" node takes in a "vessel arrival forecast" node and produces a "berth schedule" node. A "crew optimiser" node consumes "maintenance task" and "crew availability" nodes and produces a "work order" node. By making these relationships explicit, the full computational logic of the system becomes transparent and easy to reason about.
Applications Graph — FDK
The applications graph defines how users interact with the system, configured using the Frontend Development Kit (FDK). Each application is a node; its edges show which parts of the data and models graphs it accesses. A "terminal dashboard" node is linked to "berth schedule" data and the "re-plan trigger" model. A "mine control room" node is connected to "fleet utilisation" data and the "dispatch optimiser" model.
Because applications, data, and models are separate but linked entities, you can change the underlying model without rebuilding the interface — and vice versa.
Compute Graph — Nexus
The compute graph is the operational layer, visible in Nexus. It maps the other three graphs onto available compute resources — servers, containers, GPUs. The edges in this graph show which parts of the data, models, and applications graphs are running on which infrastructure at any given moment.
This graph is dynamic: it can automatically shift workloads to the most efficient resources based on real-time demand, enabling the faster-than-real-time performance the AIF is designed around.
Modelling with OR: Single Responsibility
A key consequence of the graph-based approach is a shift away from large, monolithic models that try to do everything at once. OR is designed around model workflows — individual, focused models chained together to build complex, multi-stage processes.
Each model in a workflow has a single, well-defined job: clean this data, run this calculation, generate this forecast, solve this optimisation. By chaining these independent models together, you can build sophisticated systems that are modular, easy to debug, and easy to iterate on. A single model can appear in many different workflows. Replacing one model in a chain does not require touching the others.
A practical tip when designing with OR: embrace the Single Responsibility Principle. Instead of thinking about one giant, all-encompassing model, ask: "What is the smallest, most focused task this component can perform?" Break the problem down into discrete steps. Each step becomes its own self-contained model. Over time, you build a library of reusable components that can be assembled in new ways to solve new problems — without starting from scratch each time.
Why This Matters
Unified and Transparent Architecture
Instead of separate databases, codebases, and deployment scripts, everything is part of a single, coherent system. A developer can trace a piece of data from its source, through every model that processes it, to every application that displays it, and on to the specific compute resource running the workload — all within a single navigable graph. Debugging, analysis, and system understanding become significantly simpler.
Agility and Reusability
Because models, data, and applications are separate but linked entities, swapping out one component does not require touching the others. Replacing a forecasting model means replacing that model node; all linked applications automatically use the new one. This design fosters rapid iteration and a culture of reuse — teams build on what already works rather than rebuilding from scratch.
Self-Healing and Scalability
The dynamic compute graph enables automatic resilience and scaling. If a compute node fails, workloads can be re-routed to available resources. If a model or application experiences a surge in demand, the compute graph can dynamically allocate more resources without manual intervention. This inherent adaptability is difficult to achieve with static, traditional architectures.
Semantic Understanding
By explicitly linking data, models, and applications, the system has structured knowledge of its own purpose. It knows what a piece of data is used for, which models it influences, and which applications surface it to users. This enables advanced capabilities: automated data lineage tracking, impact analysis ("if I change this model, which applications are affected?"), and intelligent resource allocation. The graph is not just a deployment model — it is the system's understanding of itself.